Customer Journey Analytics
Unlock valuable insights into customer behavior, preferences, and needs, enabling you to make data-driven decisions for improving the customer experience, increasing conversions, and boosting ROI.
Benefits
Analyze grouped customers based on shared characteristics or experiences.
Real-time data to identify emerging trends and patterns in customer behavior.
Address user issues that may be hindering customer progress/satisfaction.
Evaluate the effectiveness of your users from different sources.
Paralleled view into two different customer journeys to know userflow.
Precise depiction of customer paths from sankey charts to path analysis.
Streamline Customer Journeys with Visualizations
Analyze every touchpoint of customers on your website to optimize the entire customer experience journey, leading to driven revenue growth.
Comprehensive View of Customer Journeys
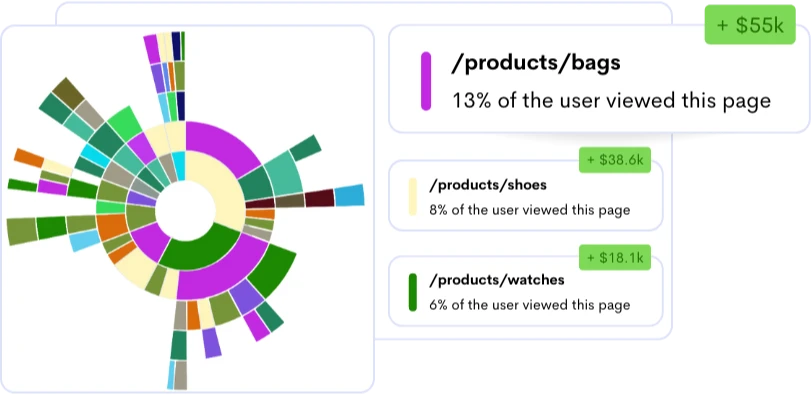
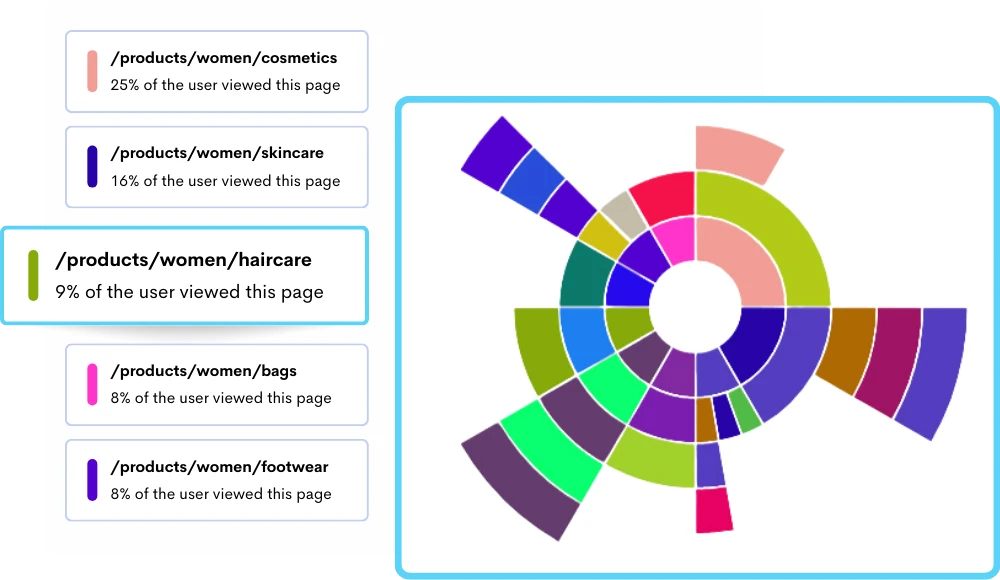
Gain a comprehensive understanding of your customer's interactions with your website, visualizing their paths and identifying optimization opportunities.
- Dynamic Map of Interactions: Visualize the entire customer experience journey from their initial entry point to their final interactions.
- Stop Customer Churn: Understand the reasons behind customer churn and implement proactive measures to retain customers.
- Customer Journey Touchpoints: Capture each instance of user engagement, from clicks and scrolls to interactions with specific elements.
Decode Looping Behaviors and Uncharted Journeys
Understand unexplored customer journeys to transform looping behaviors into satisfied seamless interactions and uncharted journeys into strategic revenue opportunities.
- Spot Unconventional Routes: Pinpoint where users take journey in loops to find where customers take low opportunity paths.
- Create Anticipated Journeys: Put together clean user intent navigation preferences that shape your conversion strategy.
- Increase Revenue: Data-driven decisions based on customer journey analysis to increase conversion rates and revenue growth.
Visuals that Speak Actionable Smart Decisions
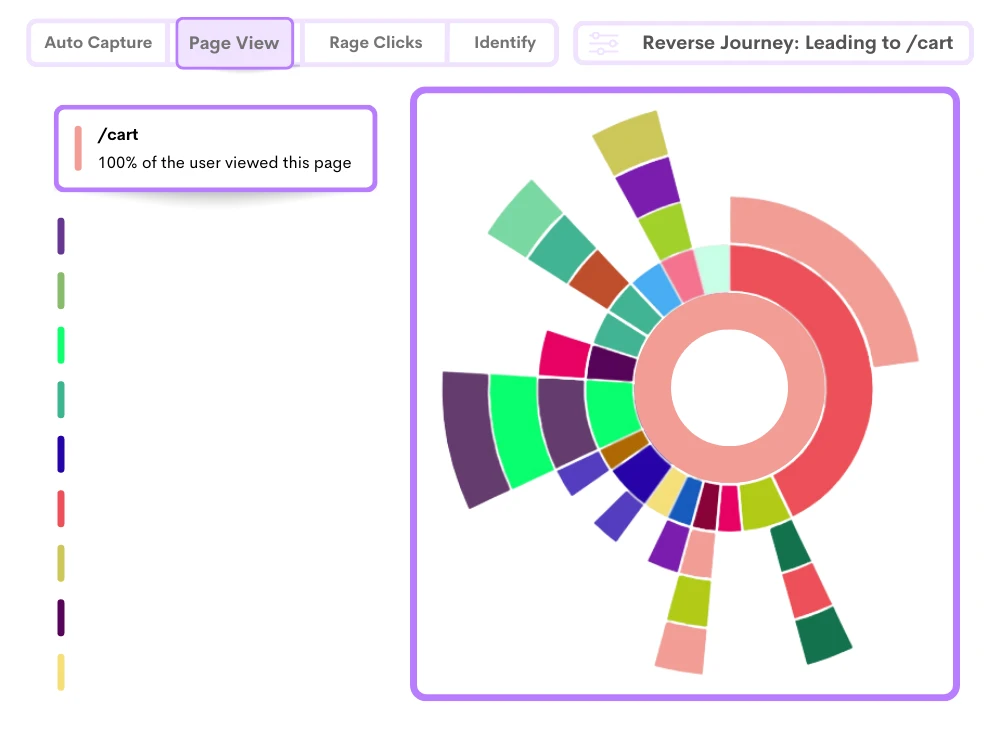
Analyze the customer journey experience before they reach particular behaviors, preferences, pages, and events, such as errors and site abandonment.
- Insightful Analysis: Uncover critical customer journey touchpoints and insights about customers' behavior and preferences.
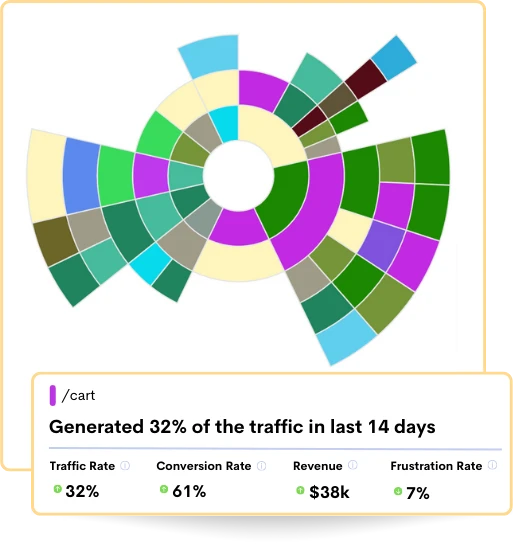
- Continuous Optimization: Transform your website's customer journey map by consistently increasing site traffic and conversion rates and minimizing frustration.
- Effective Monitoring: Transform your website's customer journey map by consistently increasing site traffic and conversion rates and minimizing frustration.
Frequently Asked Questions
CJA combines data from various sources, such as clicks, scrolls, form submissions, and more, to visually represent the user journey. This visualization helps businesses identify pain points, drop-off points, and opportunities for optimization. The platform's machine-learning capabilities allow for identifying patterns and trends that might be overlooked.
By using customer journey analytics, digital businesses can make informed decisions to enhance user experiences, increase conversion rates, and improve overall customer satisfaction. The platform's intuitive reporting and visualization tools facilitate clear communication of insights to stakeholders, enabling data-driven strategies that align with business goals and drive positive outcomes.
In contrast, CJA involves systematically collecting and analyzing data related to customer interactions across multiple touchpoints. It delves into quantitative insights, such as click-through rates, conversion rates, and time spent at different stages. This data-driven approach provides objective insights into customer behavior, pain points, and opportunities for optimization.
While customer journey mapping provides a qualitative view of the customer's perspective, customer journey analytics offers a quantitative assessment of customer interactions.
Combining these quantitative and qualitative methods allows you to uncover pain points, usability issues, or confusing touchpoints that hinder a smooth customer journey. With these insights, you can take targeted actions to optimize and streamline those bottlenecked areas, ultimately improving customer satisfaction and overall conversion rates.
- Click Heatmaps: Visual representations of where users click on web pages provide insights into areas of high engagement and potential pain points.
- Scroll Depth: Analyzing how far users scroll down a page indicates the extent to which they consume content and engage with information.
- Exit Pages: Identifying the pages where users exit the journey helps pinpoint stages needing improvement or further investigation.
- Time Spent on Pages: Understanding how much time users spend on different pages offers insights into the content's relevance and engagement level.
- Conversion Funnels: Mapping the journey from initial interaction to conversion highlights stages where users drop off, aiding optimization efforts.
- Interaction Patterns: Analyzing users' actions during the journey reveals common paths and behaviors.
- Device and Platform Data: Insights into whether users engage via desktop, mobile, or tablet devices help optimize experiences for different platforms.
- Geographical Data: Understanding users' location can lead to localized content and experiences catering to specific regions.
- Referral Sources: Identifying where users come from (search engines, social media, direct links) helps allocate marketing efforts effectively.
- Repeat Visits: Monitoring how often users return to the website or app indicates ongoing engagement and interest.
Understanding the entire customer journey allows for targeted interventions. For instance, if analytics show that customers often abandon their carts during checkout, businesses can optimize the checkout experience, simplify forms, or offer incentives to encourage completion.
By consistently monitoring customer journey analytics, businesses can adapt and refine strategies to meet evolving customer expectations leading to improved customer retention rates.
1. Quick and easy data analysis: Data visualization tools such as charts, graphs, and maps make it easy to quickly analyze large amounts of data. This helps you identify patterns and trends in customer behavior that are difficult to spot.
2. Data-driven decision-making: Data visualization can help you make data-driven decisions by providing a clear and concise picture of customer behavior. This can help you prioritize initiatives and allocate resources more effectively.
3. Simple data: Customer journey analysis involves a lot of complex data, including clickstream data, conversion rates, and customer feedback. Data visualization tools can simplify this data and make it more accessible to stakeholders who may not have a technical background.
4. Improved communication: Data visualization tools can help you communicate your findings to stakeholders more effectively. By presenting your data clearly and visually appealingly, you can make it easier for others to understand your insights and recommendations.
- Insightful Understanding: Customer journey analysis provides a holistic view of how customers engage with a brand throughout their entire experience.
- Identifying Pain Points: It helps identify customer pain points and obstacles, enabling businesses to rectify issues and enhance the experience.
- Personalization Potential: Through analysis, businesses can personalize interactions based on customer behavior and preferences, fostering more profound connections.
- Improved Satisfaction: By optimizing touchpoints and addressing concerns, customer satisfaction and loyalty are boosted, leading to repeat business.
- Strategic Alignment: Analyzing customer journeys aligns business strategies with evolving customer expectations, ensuring relevance and adaptability.
- Resource Efficiency: Insights gained allow for efficient allocation of resources, focusing efforts on the most impactful touchpoints.
- Adaptation to Trends: CJA helps businesses stay agile by adapting to changing trends and evolving customer behaviors.
Stop guessing what your users want
Understand every user interaction with powerful analytics tools.
Session Replay
Watch exactly how users interact with your product through pixel-perfect session recordings.
Tags & Segments
Organize sessions with tags and create segments for targeted analysis.
Quick Setup
Install in minutes with a single JavaScript snippet. No complex configuration required.
Performance Metrics
Monitor page load times and performance to improve user experience.
Unlimited Team
Invite your entire team and stakeholders at no additional cost.
Privacy Controls
Block IPs, mask sensitive data, and stay compliant with privacy regulations.
Start using ReplayBird for free
Understand your users with session replay, heatmaps, and product analytics.
- Free 14-day trial
- No credit card required
- Unlimited team members
Explore All Features
Everything you need to understand user behavior and improve your product experience.

Product Analytics
Track user behavior, measure engagement, and make data-driven product decisions.

Session Replay
Watch real user sessions to see exactly how users interact with your product.

Interaction Heatmaps
Visualize clicks, scrolls, and engagement patterns across your pages.

Error Tracking
Catch and fix frontend errors before they impact user experience.

Funnel Analysis
Identify drop-off points and optimize your conversion funnels.

Customer Journey
Map the complete user journey from first touch to conversion.

Form Analysis
Understand form interactions and reduce abandonment rates.

Speed Analysis
Monitor performance and its impact on user experience.