What are Heatmaps?

Heatmaps are the graphical representation of any map or screen displayed.
The heatmap denotes different color shades from red to dark blue, representing hot to cold.
The hotter it is, the darker the red (maroon) is visualized, and the colder it is, the bluer it is.
A heatmap is a type of data visualization that shows the highest to the lowest calculated value of a region.
Heatmaps with websites:
Looking at all the data about the website visitors is quite hard to understand, which is why we use web analytics tools.
Web analytics makes it simple to understand with all the diagrams and charts.
Now heatmaps also come under analytics, which breaks down larger information into a simpler graphical representation.
Heatmaps for websites show:
- What are the most clicked elements?
- Where do visitors’ cursors move around?
- Which is the specific spot visitors scroll through for a longer period of time?
- What is the most ignored element by many website visitors?
- What spots did not seek attention from the website visitors?
These are questions heatmaps answer, which will help your website to increase its conversion rate.
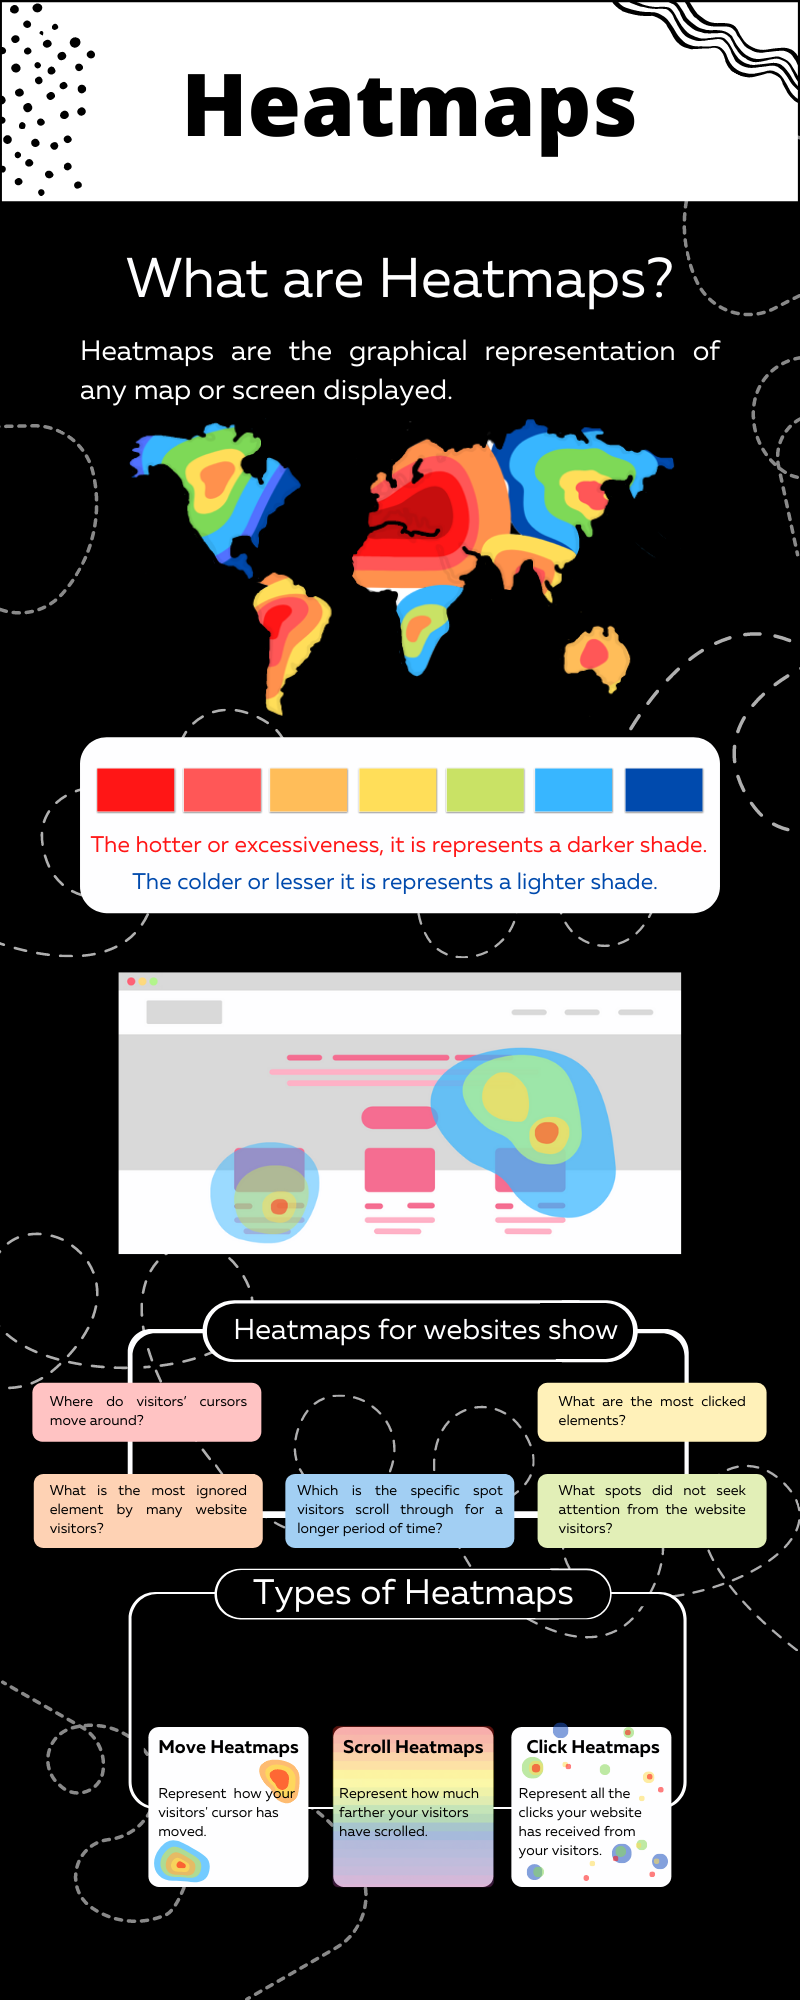
Major Types of Heatmaps:
Click Heatmaps:
- Learn what the most clicked elements are or what the most ignored spots on your website are.
- Click heatmaps produce a visualization with colors of all the clicks your website has received from your visitors.
Scroll Heatmaps:
- The Scroll map does not care about the clicks or elements.
- It conveys the horizontal perspective of your website.
- You can understand how much farther your visitors have scrolled, where they stopped, where they scrolled quickly and ignored.
Mouse move Heatmaps:
- While navigating your website, note how your visitors’ cursor has moved.
- You can understand if the visitor is reading, moving around to buy something, or engaging in any other interaction.
Uses of Heatmaps:
- Design of the website matters because it is how you present your brand or company to your visitor.
- It has to be easy to skim and scan for the visitors.
- If you have designed a sign-in button somewhere in the left corner, it is now unnoticeable.
- Some visitors go through your website rapidly.
- When the designer has not placed the sign-in button at the right easy spot then it is not gain the attention of the visitors.
Heatmap will show you where all your visitors click or move their cursor often, and now it is the right spot to gain visitors’ attention.
You can decide where to add CTA (call to action) on your website.
Try ReplayBird for free
Free 14-day trial. No credit card required. Easy setup.