Dashboards - Everything in One Place
Visualize your product and user data with dashboards to connect every data point to your user behaviors and their metrics under one roof.
Benefits
Instantly capture and analyze behaviors as they happen in real-time.
Gain comprehensive customer insights for a complete understanding.
Identify emerging possibilities to drive revenue growth
Remove barriers and delight customers with effortless interactions.
Effectively address, troubleshoot, and resolve problems for prompt resolution.
Prioritize privacy and secure integration for driving continuous innovation.
Connect all Dots with Our Dashboard
Struggling to navigate through a deluge of data to pinpoint crucial metrics? ReplayBird's innovative product analytics and customizable dashboard offer seamless solution.
See Data However You Like with Customizable Dashboard
With our no-code approach, Everyone can now create and customize their dashboard hassle free selecting specific metrics and data points that matter the most.
- Under one Roof: Multiple metrics as one dashboard view that displays all of your data on a single screen.
- Ease Implementation: You’re right where you need to be with the minimal number of clicks.
- Flexibility: Create tailor-made reporting tools that perfectly suit your business needs.
Qualitative Reasons Behind Quantitative Metrics
Understand underlying qualitative factors that influence and explain the changes of your user experience data and variations observed in numerical or quantitative data.
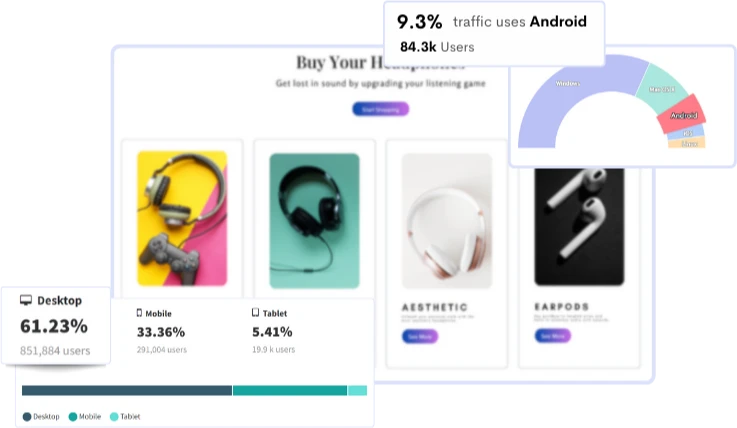
- Visual Understanding: Witness firsthand how users engage with your platform with dashboard integrated with multiple metrics to identify user pain points.
- Friction Detection: Focus on why users might be abandoning certain processes or encountering obstacles, leading to specific numerical outcomes.
- Granular Analyzation: Spot behavior difference within various user segments of same metrics with multiple dashboards to know why certain segments might exhibit.
Coordinate Work Across Your Teams and Organization
Generate unlimited dashboards customized for various audiences: product, marketing, executives, and more, as per distinct needs of each of your diverse teams.
- Simple Sharing: Share your tailored dashboards within your team members instantly just with a link.
- Instant Prioritization: Quickly identify what needs your attention to boost team productivity and promote more efficient workflows.
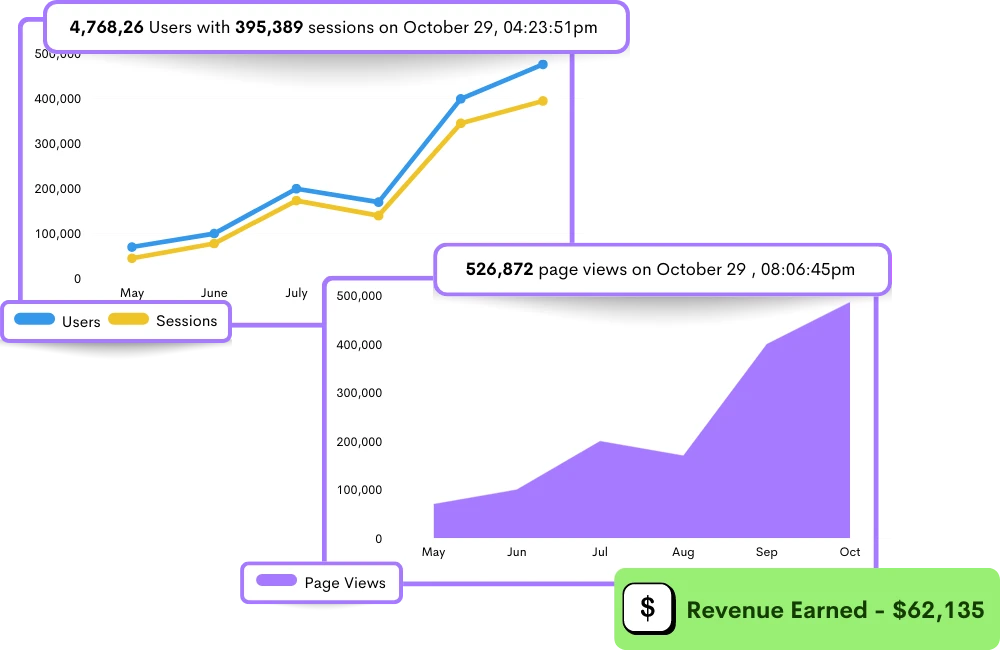
- Rich Insights in a Glance: Visualize your progress in multiple formats like pie, line, and bar graphs, allowing flexibility in how you track your work.
Frequently Asked Questions
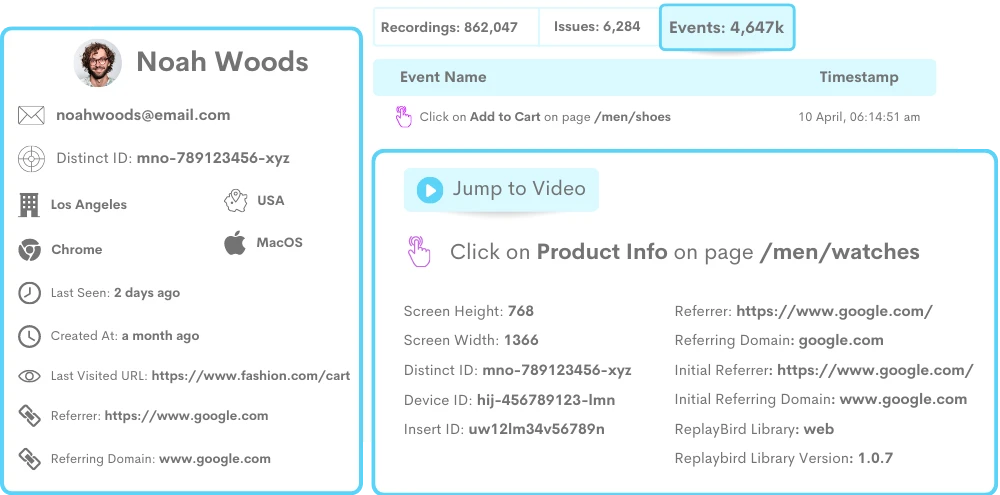
It provides a deeper understanding of important data such as user behavior, session recordings, event tracking, conversion rates, and other performance indicators. This tool aids in understanding user engagement, identifying patterns, and making data-driven decisions to optimize user experience and product performance.
- User Engagement Metrics such as click heatmaps, events like rage clicks, navigation metrics and submissions.
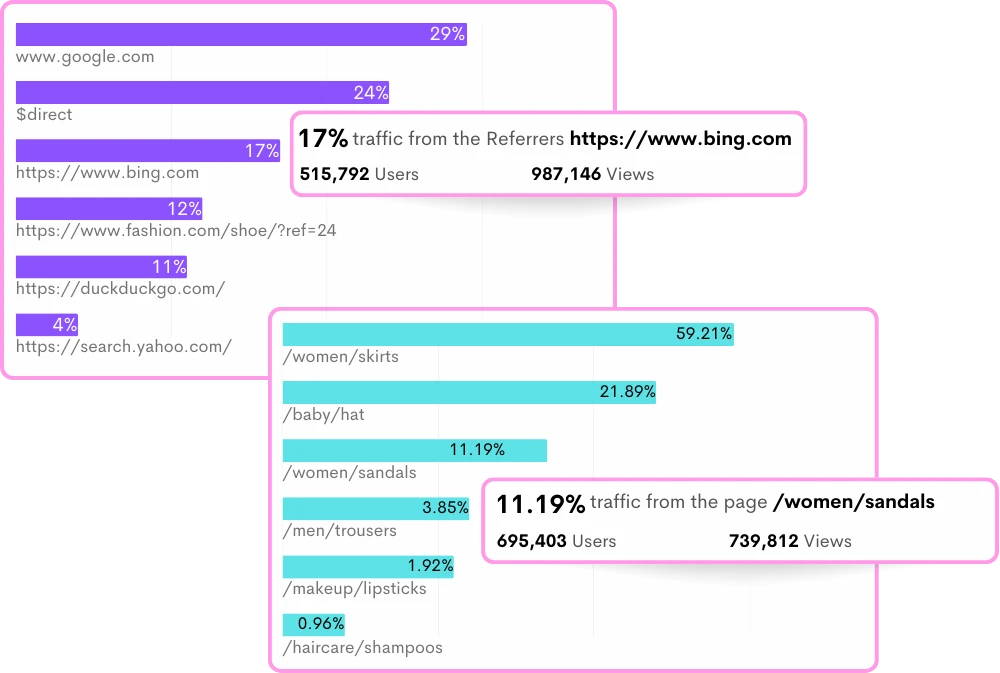
- Page views such as top pages/screens, conversion marketing funnels, customer journey analytics and path analysis.
- Error and Issue Metrics such as Front end error reports and JavaScript errors.
- Custom Metrics such as custom events and custom segments.
- Performance Metrics such as load time and network requests, geographical, device, and browser usages.
Stop guessing what your users want
Understand every user interaction with powerful analytics tools.
Session Replay
Watch exactly how users interact with your product through pixel-perfect session recordings.
Tags & Segments
Organize sessions with tags and create segments for targeted analysis.
Quick Setup
Install in minutes with a single JavaScript snippet. No complex configuration required.
Performance Metrics
Monitor page load times and performance to improve user experience.
Unlimited Team
Invite your entire team and stakeholders at no additional cost.
Privacy Controls
Block IPs, mask sensitive data, and stay compliant with privacy regulations.
Start using ReplayBird for free
Understand your users with session replay, heatmaps, and product analytics.
- Free 14-day trial
- No credit card required
- Unlimited team members
Explore All Features
Everything you need to understand user behavior and improve your product experience.

Product Analytics
Track user behavior, measure engagement, and make data-driven product decisions.

Session Replay
Watch real user sessions to see exactly how users interact with your product.

Interaction Heatmaps
Visualize clicks, scrolls, and engagement patterns across your pages.

Error Tracking
Catch and fix frontend errors before they impact user experience.

Funnel Analysis
Identify drop-off points and optimize your conversion funnels.

Customer Journey
Map the complete user journey from first touch to conversion.

Form Analysis
Understand form interactions and reduce abandonment rates.

Speed Analysis
Monitor performance and its impact on user experience.