Path Analysis
Analyze the path to track deeply into user journey throughout your website and uncover where users may be navigating within your application, especially if they exit the intended funnel.
Benefits
Instantly capture and analyze behaviors as they happen in real-time.
Gain comprehensive customer insights for a complete understanding.
Identify emerging possibilities to drive revenue growth
Remove barriers and delight customers with effortless interactions.
Effectively address, troubleshoot, and resolve problems for prompt resolution.
Prioritize privacy and secure integration for driving continuous innovation.
Map out All Path Flows of Your Website
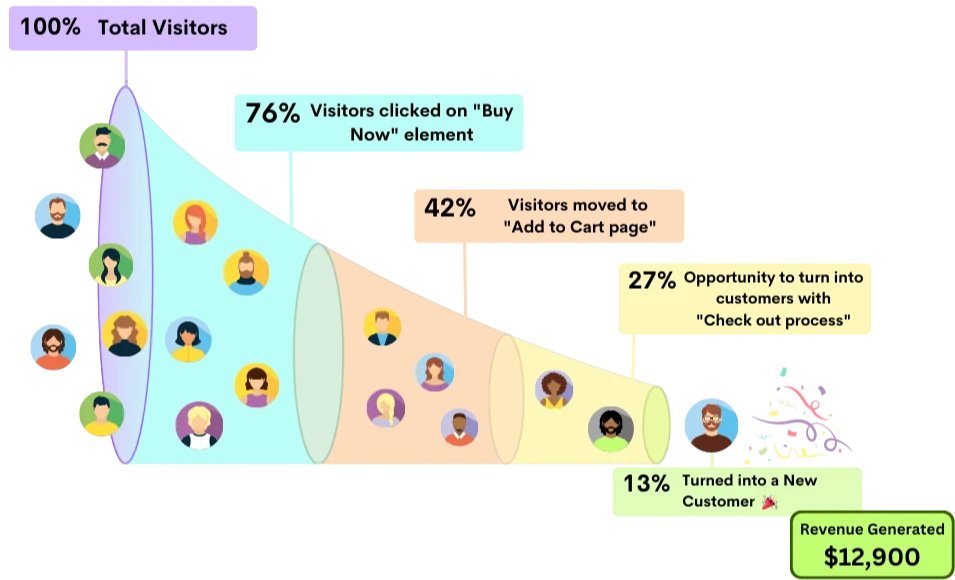
Get a holistic view of into every action taken by users on your product or website to analyze accurate funnel conversions.
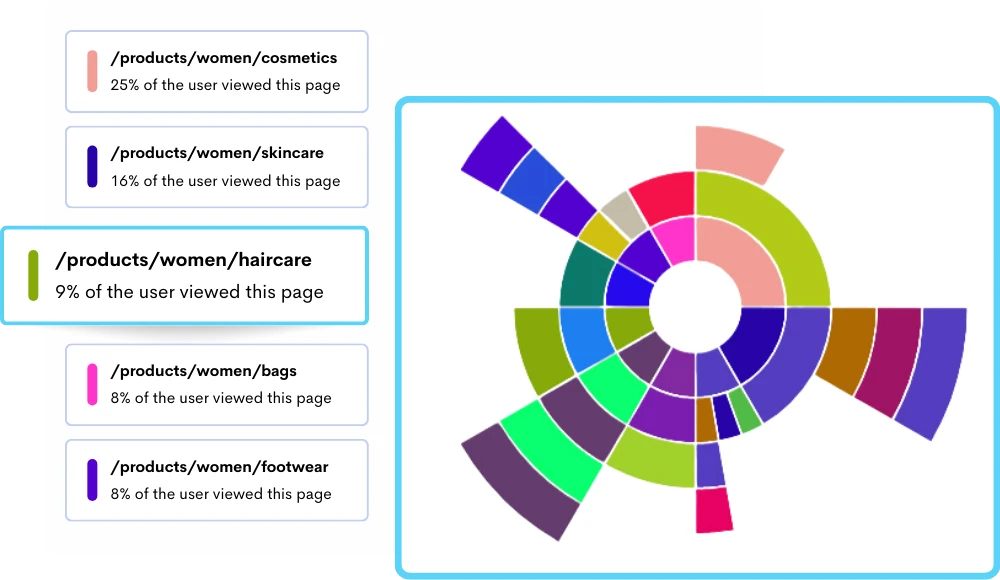
Understand Where Users are Leading into Your Website with Path Analysis
Figure out the accurate reason behind your user’s journeys to make informed decisions, improve the user experience, optimize content placement, and ultimately achieve their conversion goals.
- Uncover user behavior patterns.
- Identify conversion funnel bottlenecks.
- Build strategies that generate the highest return on investment.
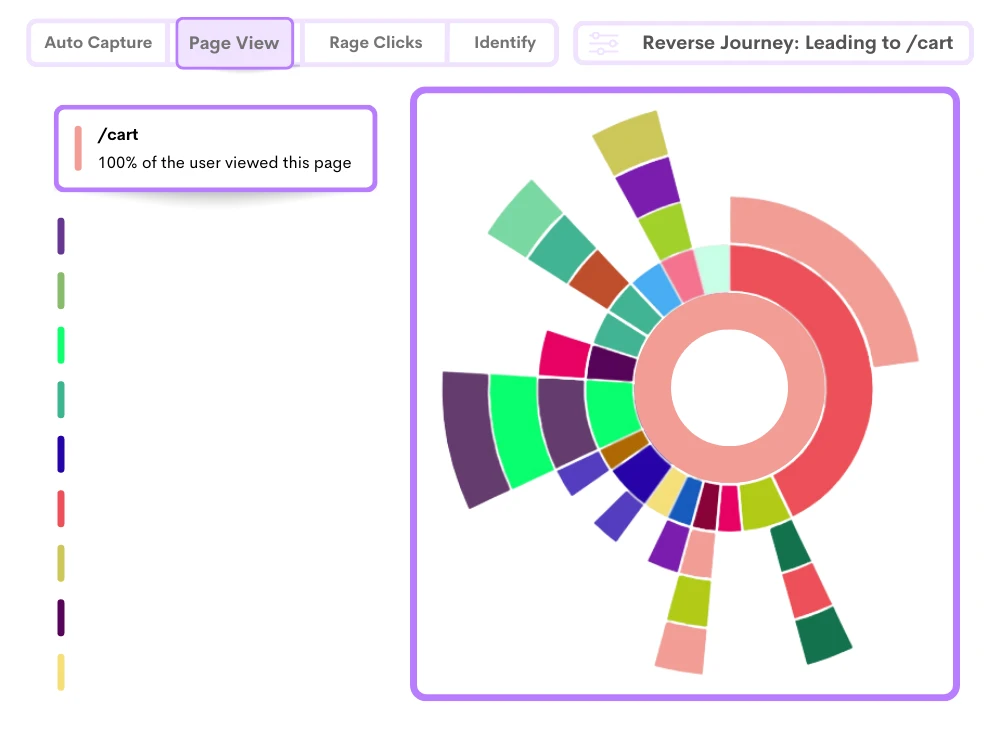
Identify Bottleneck Points Where Users are Dropping-off Before Converting
Spot stages and interactions where users abandon the path before completing a desired action, such as purchasing or filling out a contact form.
- Track users at each stage of their journey with path analysis.
- Deeper insights into every individual user interaction.
- Find out frictions like confusing navigation, excessive form fields, or a lack of clear calls-to-action.
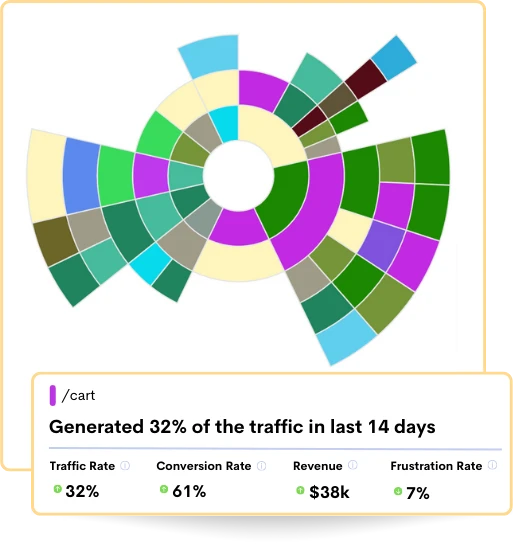
In-depth Path Analysis to Understand Key Influencing Factors
Go beyond basic pageview tracking, providing a detailed account of user interactions and the sequence of actions they perform with comprehensive insights into user behavior.
- Analyze the most prevalent devices and operating systems.
- Identify the top referrers and the sources driving traffic to the website.
- Focus on countries and regions with the highest user engagement.
Frequently Asked Questions
By looking at these paths, businesses learn where users often go and where they might leave. This helps make websites better by fixing problems and making things easier to find. Also, it's a tool that helps understand how people use websites and apps to improve their experience.
2. Popular & Problem Areas: Identifies where users go most and where they struggle.
3. Better Experience: Improves site/app usability for users.
4. Conversion Improvement: Understand why users may not complete actions (e.g., buying).
5. Optimized Performance: Adjusts content/layout based on user behavior.
Journey path analysis is like a detective tool that looks at how people move around online places like websites or apps. It shows us the steps users take, like where they start, what they look at, and where they stop. For instance, it might tell us that when people shop online, they first check categories, then items, add stuff to their cart, and finally buy. This helps make websites better and helps people buy things more easily.
Customer Journey:
The customer journey is like a trip that a person takes when they interact with a brand, whether it's online or in real life. It includes everything from when they first find out about the brand to when they buy something and even after that. For example, someone might see an ad on social media, then visit the website, check out the store, and finally buy something online. Understanding this journey helps businesses make better plans for advertising and improve how they interact with customers, aiming to keep customers happy and coming back.
Its advanced features let you closely look at their clicks and how they move around. This tool makes it easier to understand user behavior and helps you make smart choices based on data to make your website better and help more visitors become customers.
1. Popular Entry Points: Identifies where users typically start their journey on the website.
2. Exit Points: Highlights where users leave the website, indicating potential areas for improvement.
3. Conversion Rates: Measures the percentage of users who complete a desired action, such as making a purchase or filling out a form.
4. Time Spent on Pages: Indicates how long users engage with specific content or pages.
5. Number of Interactions: Tracks the frequency of user interactions at various touchpoints.
6. Drop-off Rates: Reveals where users abandon their journey, pointing to potential bottlenecks or issues.
This streamlined process increases the likelihood of users completing conversions, ultimately leading to higher conversion rates.
Stop guessing what your users want
Understand every user interaction with powerful analytics tools.
Session Replay
Watch exactly how users interact with your product through pixel-perfect session recordings.
Tags & Segments
Organize sessions with tags and create segments for targeted analysis.
Quick Setup
Install in minutes with a single JavaScript snippet. No complex configuration required.
Performance Metrics
Monitor page load times and performance to improve user experience.
Unlimited Team
Invite your entire team and stakeholders at no additional cost.
Privacy Controls
Block IPs, mask sensitive data, and stay compliant with privacy regulations.
Start using ReplayBird for free
Understand your users with session replay, heatmaps, and product analytics.
- Free 14-day trial
- No credit card required
- Unlimited team members
Explore All Features
Everything you need to understand user behavior and improve your product experience.

Product Analytics
Track user behavior, measure engagement, and make data-driven product decisions.

Session Replay
Watch real user sessions to see exactly how users interact with your product.

Interaction Heatmaps
Visualize clicks, scrolls, and engagement patterns across your pages.

Error Tracking
Catch and fix frontend errors before they impact user experience.

Funnel Analysis
Identify drop-off points and optimize your conversion funnels.

Customer Journey
Map the complete user journey from first touch to conversion.

Form Analysis
Understand form interactions and reduce abandonment rates.

Speed Analysis
Monitor performance and its impact on user experience.