Interaction & Heatmaps
Understand how users interact with each element on your website to optimize your website for user engagement and conversions. Uncover which elements on a website receive more attention, which receives the most clicks, and the content that causes users to leave the website.
Benefits
Instantly capture and analyze behaviors as they happen in real-time.
Gain comprehensive customer insights for a complete understanding.
Identify emerging possibilities to drive revenue growth
Remove barriers and delight customers with effortless interactions.
Effectively address, troubleshoot, and resolve problems for prompt resolution.
Prioritize privacy and secure integration for driving continuous innovation.
ReplayBird Exposes What Attracts Your Audience
Identify areas for improvement, reduce friction in the customer journey, and provide a better user experience.
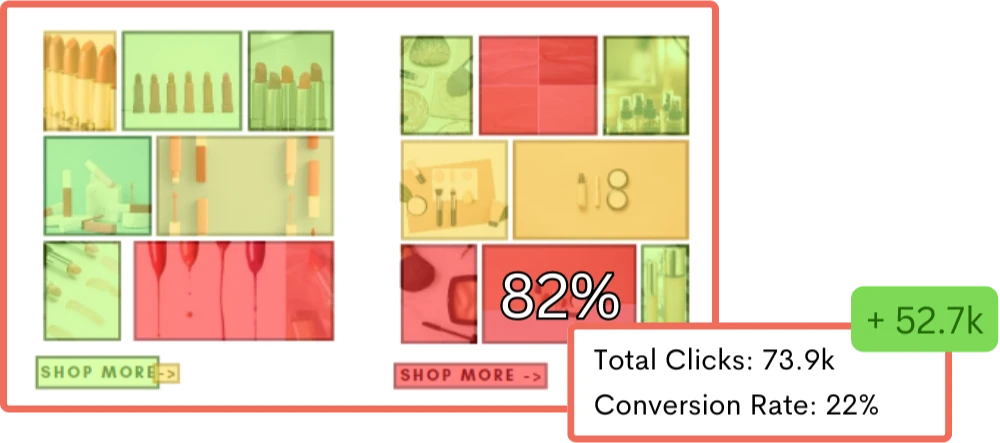
Maximize Engagement that Improves Navigation
Visualize how users interact with your website to identify high and low-engagement areas that create a positive user experience leading to increased conversions and business growth.
- Discover Engagement Opportunities: Unleash areas where users spend the most time, where they click the most, and where they scroll the most.
- Remove Obstacles: Eliminate elements that are causing users to lose interest, such as confusing navigation or irrelevant content.
- Improve Navigation: Get users to easily navigate your website and find what they are looking for; they are more likely to convert, leading to increased revenue and higher customer satisfaction.
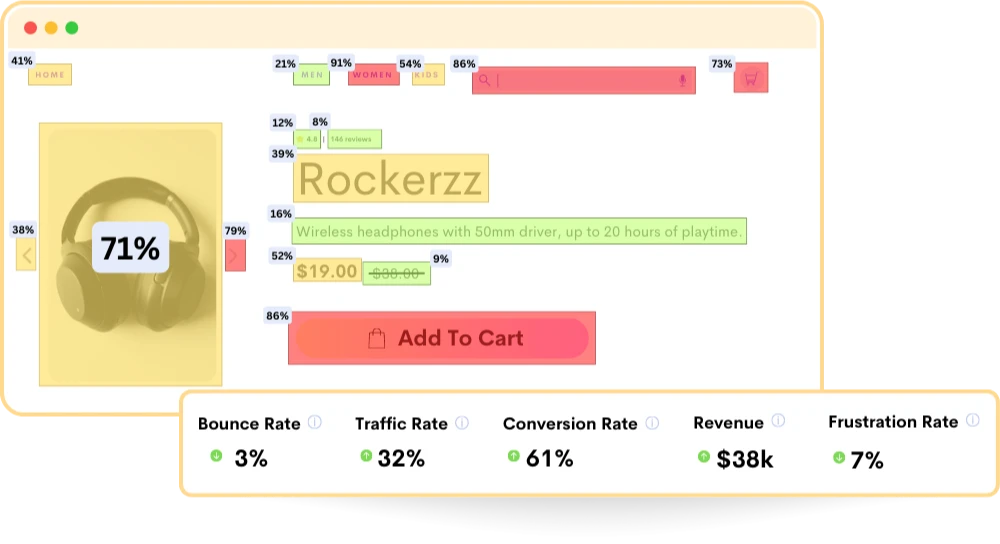
Uncover Product Page Engagement Patterns
In-depth analysis of product page engagement patterns to increase conversions, improve customer experience, and ultimately drive more revenue.
- Engagement Insights: Insights on elements that receive the most clicks, attention, and engagement from users to improve the layout, design, and content of your product pages.
- Reduce Friction: Discover areas where users hesitate or get stuck on your product pages, then make changes to reduce friction.
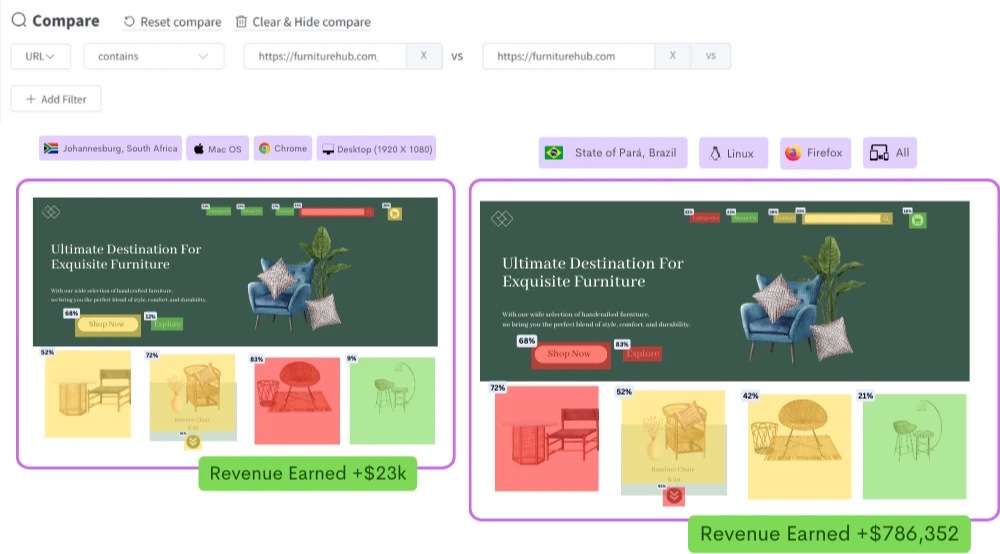
- Boost Revenue: Find out which products are performing well and which are underperforming, then make data-driven decisions on pricing, promotion, and merchandising to maximize revenue.
Reduced Bounce Rate and Improved CTAs
Identify elements that contribute to high bounce rates on your website to make changes for high engagement and make changes to improve CTA performance and increase conversions.
- Identify Problematic Elements: Pinpoint areas of low and high engagement to make design changes to improve user experience.
- Optimize Call To Action: Identify which CTAs are performing well and which are not to increase click-through rates and conversions.
- Impactful Analytics: Track the impact of changes you make to your website, giving you the data you need to make informed decisions and continue to improve revenue over time.
Frequently Asked Questions
They provide valuable insights into user behavior and help website owners optimize their sites for improved user experience and increased conversions. Heatmaps can identify areas for improvement in website design and content.
Click heatmaps are useful for identifying popular website areas, while scroll heatmaps are helpful for understanding user engagement and identifying where users may lose interest or attention.
This data can be used to identify areas of high and low engagement, track user journeys, and make data-driven decisions on website layout, content, and functionality. By optimizing a website based on heatmap data, businesses can improve user experience, increase conversions, and ultimately drive revenue.
Heatmaps are not limited to e-commerce websites and can be used by any type of website to improve performance.
By analyzing user behavior and engagement patterns on a webpage, heatmaps can highlight which elements receive the most attention and which are being ignored or overlooked.
This information can be used to make changes to the layout, design, and content of a webpage to optimize it for user engagement and improve conversions.
Stop guessing what your users want
Understand every user interaction with powerful analytics tools.
Session Replay
Watch exactly how users interact with your product through pixel-perfect session recordings.
Tags & Segments
Organize sessions with tags and create segments for targeted analysis.
Quick Setup
Install in minutes with a single JavaScript snippet. No complex configuration required.
Performance Metrics
Monitor page load times and performance to improve user experience.
Unlimited Team
Invite your entire team and stakeholders at no additional cost.
Privacy Controls
Block IPs, mask sensitive data, and stay compliant with privacy regulations.
Start using ReplayBird for free
Understand your users with session replay, heatmaps, and product analytics.
- Free 14-day trial
- No credit card required
- Unlimited team members
Explore All Features
Everything you need to understand user behavior and improve your product experience.

Product Analytics
Track user behavior, measure engagement, and make data-driven product decisions.

Session Replay
Watch real user sessions to see exactly how users interact with your product.

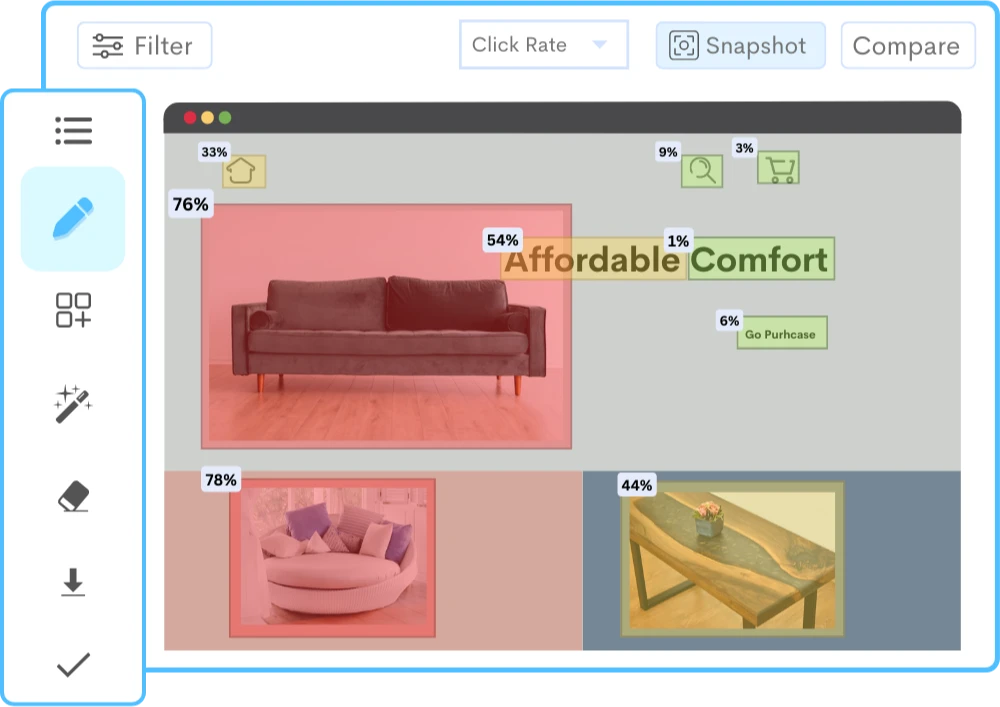
Interaction Heatmaps
Visualize clicks, scrolls, and engagement patterns across your pages.

Error Tracking
Catch and fix frontend errors before they impact user experience.

Funnel Analysis
Identify drop-off points and optimize your conversion funnels.

Customer Journey
Map the complete user journey from first touch to conversion.

Form Analysis
Understand form interactions and reduce abandonment rates.

Speed Analysis
Monitor performance and its impact on user experience.